Example: "Snapshot of program in action"
Main module:
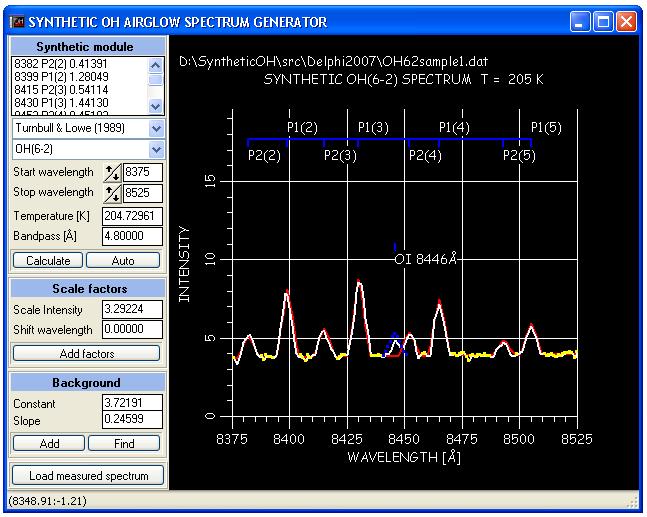
The above snapshot shows the main module of the syntheticOH.exe program. The measured spectrum is plotted with the color white. The detected backround is colored yellow. The synthetic spectrum is the red one. The menu to the left is described in the program's help file.
Note: A popup menu is activated by right clicking on the plot window.
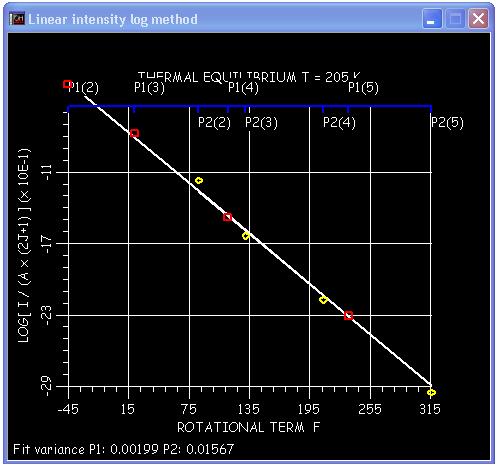
The linear log intensity energy
term method:
When the bacground level is found, the temperature is
automatically calculated by using the P1 line intensities in a
log energy term plot. See equations (5) and (6) in Theory section.
The temperature is derived from the slope of the
linear fit (white line fitted to the red squares). The yellow squares
corresponds to the P2 lines. If these values depart (spreads
away) from the linear fit, then we assume a state of non-thermal
equilibrium. The figure below shows the result for the spectrum shown above.